
Project Benson - Analyzing NYC Subway
This past week I began a more intense journey as part of the Metis Data Science summer cohort, culminating in our first project: How can we use various data sources to find the ideal subway stations to promote the annual summer gala for WomenTechWomenYes (WTWY), a fictional non-profit focused on increasing the participation of women in technology?
Goals
WTWY, like many nonprofit organizations, funds itself through the generosity of others who share its mission. Therefore, the focus of any effort to find the right people to attend its gala, be its advocate, and contribute to the cause must incorporate data from disparate sources to find the right demographic.
Assumptions
We made a couple assumptions about the timing of the gala and WTWY’s capacity to support the marketing teams: 1. The gala date will be in August 2016. 2. WTWY has a limited budget that can only support 2-3 promotional street teams at any given time.
Our Approach
The MTA turnstile data source was specifically mentioned by WTWY, and any analysis to maximize promotion efforts at subway stations should focus on rider traffic. But we also had to consider the demographics of those riders.
Our approach focused on finding th subway stations located at the nexus of three factors:
- Neighborhoods with tech employers and tech student/professors. To find subway riders with the highest likelihood of being supportive of a tech-related cause, we decided to filter for neighborhoods with strong tech employment or major universities with computer science programs. We found data on the location employers in the technology industry in New York State Comptroller Thomas P. DiNapoli’s report on New York City’s Growing High-Tech Industry.
- Higher income neighborhoods. While the wealthiest Americans don’t give a higher percentage of their incomes to charitable causes, the simple fact that they have more income to give makes them a preferred target of any fundraising effort. We used data from the American Community Survey 2006-2010 to find New York City zip codes with median incomes greater than $70,000, then found how many of these wealthier zip code where located near each subway station.
- Subway stations with the highest foot traffic. We used the tech employer and wealth data to filter our list of 384 subway stations down to the 31 with a preseance of either, then we used the July 2015 MTA turnstile data as a proxy for the traffic patterns you could expect this July, the ideal time period for promoting the August gala.
Cleaning the Data
Once we had all the turnstile data for July 2015 loaded into Python, there was still quite a bit of cleaning and calculation needed to provide meaningful numbers on which to base our analysis.
- The turnstile data only provided the cumulative number of entries and exits, not the net amount for any particular time period. We used a Python loop function to go through the data and calculate the net entries and exits for each period, then created a new column for total traffic (entries plus exits).
- The MTA collected most of its turnstile data at regular, four-hour intervals of midnight, 4am, 8am, etc. However, there were many instances where the data was an hour off of the regular schedule, and some observation times were seemingly random. To help with our time analysis, we rounded all time periods to the nearest hour, and eliminated the small proportion of data that far removed from the regular schedule.
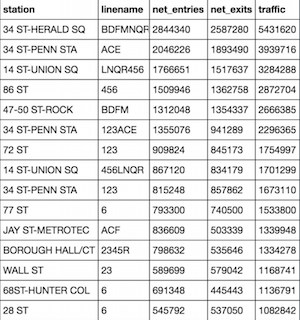
- The “STATION” names in the data set often included what were actually multiple stations, e.g. “86 ST” included the distinct stations for the 1, 456, BC, N and R trains. We decided to group all of our data by not only station, but also “LINENAME”.
Finding Our Target Stations
After cleaning the data, we were able to further narrow our station/linename targets to 15, based on the total traffic for the month of July 2015.
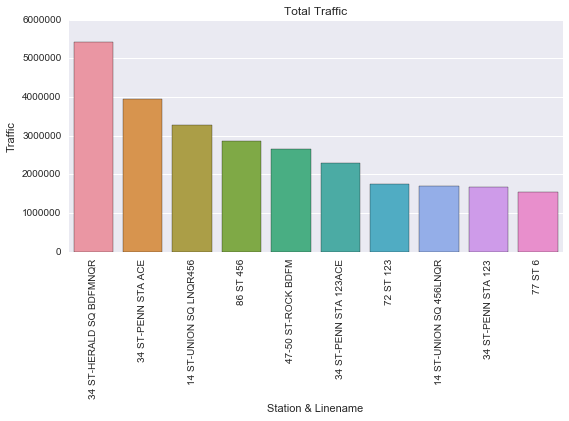
We then made two decisions to further refine the data: 1. Eliminating 34 ST - PENN STATION because it is so vast and has heavy commuter traffic, assuming that those living outside of New York City will be less willing to attend the gala. 2. Combining the two UNION SQUARE station/linename combinations as one to reflect the fact that the entrances are close to each other and there are no streets between. The assumptions is that one street team can effectively market to both entrances.
That leaves us with a top-five list to focus the gala promotion, under our assumptions that WTWY has limited resources: 1. 34 ST - Herald Square 2. 14 ST - Union Square 3. 86 ST - 456 4. 47-50 ST - Rockefeller Center 5. 72 ST - 123
What Dates/Times Are Ideal?
Now that we knew which five stations to target, we wanted to gain insight into when during the month, which day, and what time day have maximum traffic at those stations.
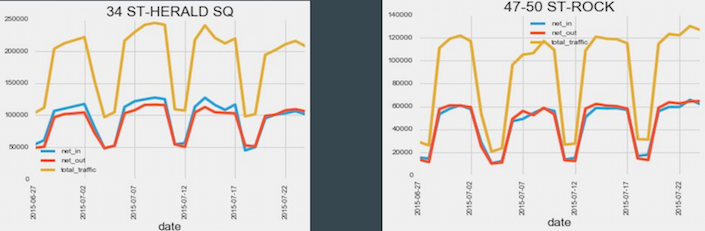
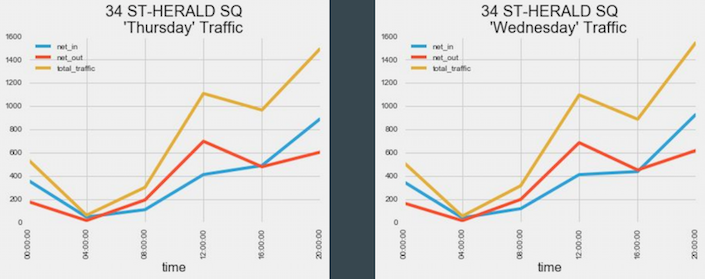
First, we looked at the net entries, exits and total traffic over the month to see if there was a pattern of traffic spiking or falling. There was a distinct traffic pattern, but it was a pattern that repeated by week, not during a time of month. The traffic patterns below for the Rockefeller Center and 34 St Herald Square are typical of the group.
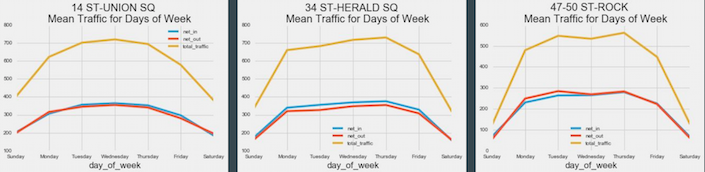
Next, we looked at the average weekly traffic by day of the week. We then see that traffic typically falls significantly during the weekend, and it lower on Monday and Friday than during the middle of the work week.
Lastly, looking at the traffic of various stations by hour of day, we see that traffic typically rises for the morning rush (8am to 12pm), falls somewhat during the early afternoon, and rises to it’s highest level during the evening rush (4pm to 8pm).
Final Recommendations
Our final recommendations based on the filtered list of stations, and the best time of week and day for maximum traffic is as follows:
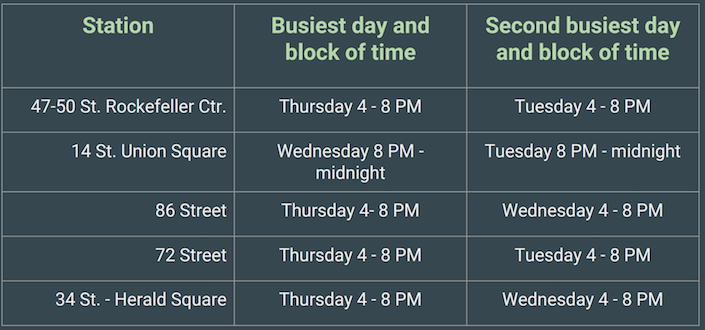
The recommended days and times typically fell into the 4pm-8pm, evening rush period, and were focused on the highest traffic days during the middle of the work week. The traffic patterns at Union Square provided some variation, with the 8pm-midnight time period having heavy traffic. These recommendations will allow WTWY to have 2-3 teams on the street at any time, even allowing for teams to transition from the evening rush at certain stations, then travel to Union Square to complete an 8-hour shift.
We decided to give WTWY the two best times for each of the top stations, knowing that we could expand or shrink the recommendation list based on any feedback around the organization’s budget.
Lessons Learned
While going into the exercise my team’s Python skills were limited, we still were able to use the powerful programming language to provide recommendations based on a detailed analysis.
As the course progresses, my focus will be on learning to be more concise and efficient with my code.
Code & Presentation
Here are links to my GitHub repository that houses my project group’s code and presentation.